
Inheriting Growth, Drawing Down Prosperity
A new report tells the Prosperity Council that Oregon is thriving and that taxes don’t matter. One claim is outdated, and the other is wrong.

Governor Tina Kotek’s Prosperity Council will be issuing its first report any day now. Leading up to that release, the SEIU and the Oregon State Building and Construction Trades Council submitted their own report to the council titled, “The High Road to Prosperity for All Oregonians.”
The unions’ report tells the council to stop worrying about Oregon’s business climate and to fund education instead. A condensed version of the case ran as an op-ed in The Oregonian by Joe Cortright, one of the report’s co-authors.
The report rests on several claims that may be true in their own right. Nevertheless, the unions’ analysis addresses the wrong question.
The question on the table is not whether Oregon prospered over the past decade or more. For the most part, the state had a decent recovery from the Great Recession.
The question the Prosperity Council must address is whether the conditions that produced earlier prosperity still hold today, and whether current policy is building prosperity for the next decade or spending down the prosperity that has accumulated over the past.
We can all agree on the obvious
The report leans on three propositions that are hard to argue against. However, each proposition presents a problem for the “high road” case it tries to build.
The first proposition is that a skilled workforce tends to be associated with higher incomes. You don’t even need a high school diploma to accept that observation. So, it’s hardly a keen insight. But it is also beside the point. The Prosperity Council isn’t debating whether education matters. It should be debating what raises educational attainment and what keeps educated people in the state. On those questions, the unions’ report is mostly silent.
Company-specific tax incentives rarely change firm behavior. The report cites Tim Bartik of the Upjohn Institute, who finds that roughly 9 in 10 incentive deals reward a decision the firm would have made anyway. For years, I have argued against company-targeted tax breaks for that very reason.
But targeted tax breaks are not the same thing as a competitive rate structure. The High Road report conflates the two. Noting that tax break bidding wars are wasteful tells you nothing about whether a gross-receipts tax or a near-top marginal rate drives people out. Those are the taxes in question, and they are not incentives.
Sure, business-climate rankings are crude clickbait composites. They lean on tax levels, bundle unlike measures together, and mean little when read as a single number in a single year. On that, the report has a point, but it’s a fairly weak point.
The signal in Oregon’s case is not where it sits in any one ranking. When several different rankings tell the same story, then together they might be on to something. When Oregon falls 28 spots in tax competitiveness over seven years, that crude measure can’t be ignored. A dipstick is a crude measure, but it does a great job of telling you when you’re low on oil.
The rear-view mirror approach to forecasting
The High Road report’s evidence for a healthy Oregon is mostly accurate. That’s because it’s uniformly backward-looking.
Its centerpiece is the Brookings Metro Monitor. Portland ranks tenth among large metros in prosperity and seventh in wage growth. Take both at face value. They measure change from 2014 to 2024 — a record of the decade Oregon just finished, ending in the year the trouble began. Since 2024, Oregon has lost nearly 32,000 jobs.
Even within the 2014-2024 window, the report shows Portland ranking a middling 25th in growth and 26th in job creation. The strongest Portland number is productivity, and in Oregon, productivity per worker is largely a story about semiconductors, which is to say a story about one company, largely.
The Oregon Office of Economic Analysis, in its 2026 forecasts, has watched its own employment outlook deteriorate to the point of flipping the sign on projected job growth, a swing of tens of thousands of jobs in a matter of months.
Portland State University’s Population Research Center and the Census Bureau show the state losing residents to other states, with the Portland metro itself recording net out-migration. Oregon’s draw for new residents, near the top of the country a decade ago, had fallen to the bottom tier by 2023. And the people leaving are not a random sample. The average filer moving into Multnomah County reports income of about $73,500, compared with nearly $107,000 for those choosing Clark County across the river.
The High Road report is a nifty summary of where we’d been heading a few years ago, but provides no guide to where we are heading now.
When correlation goes to college
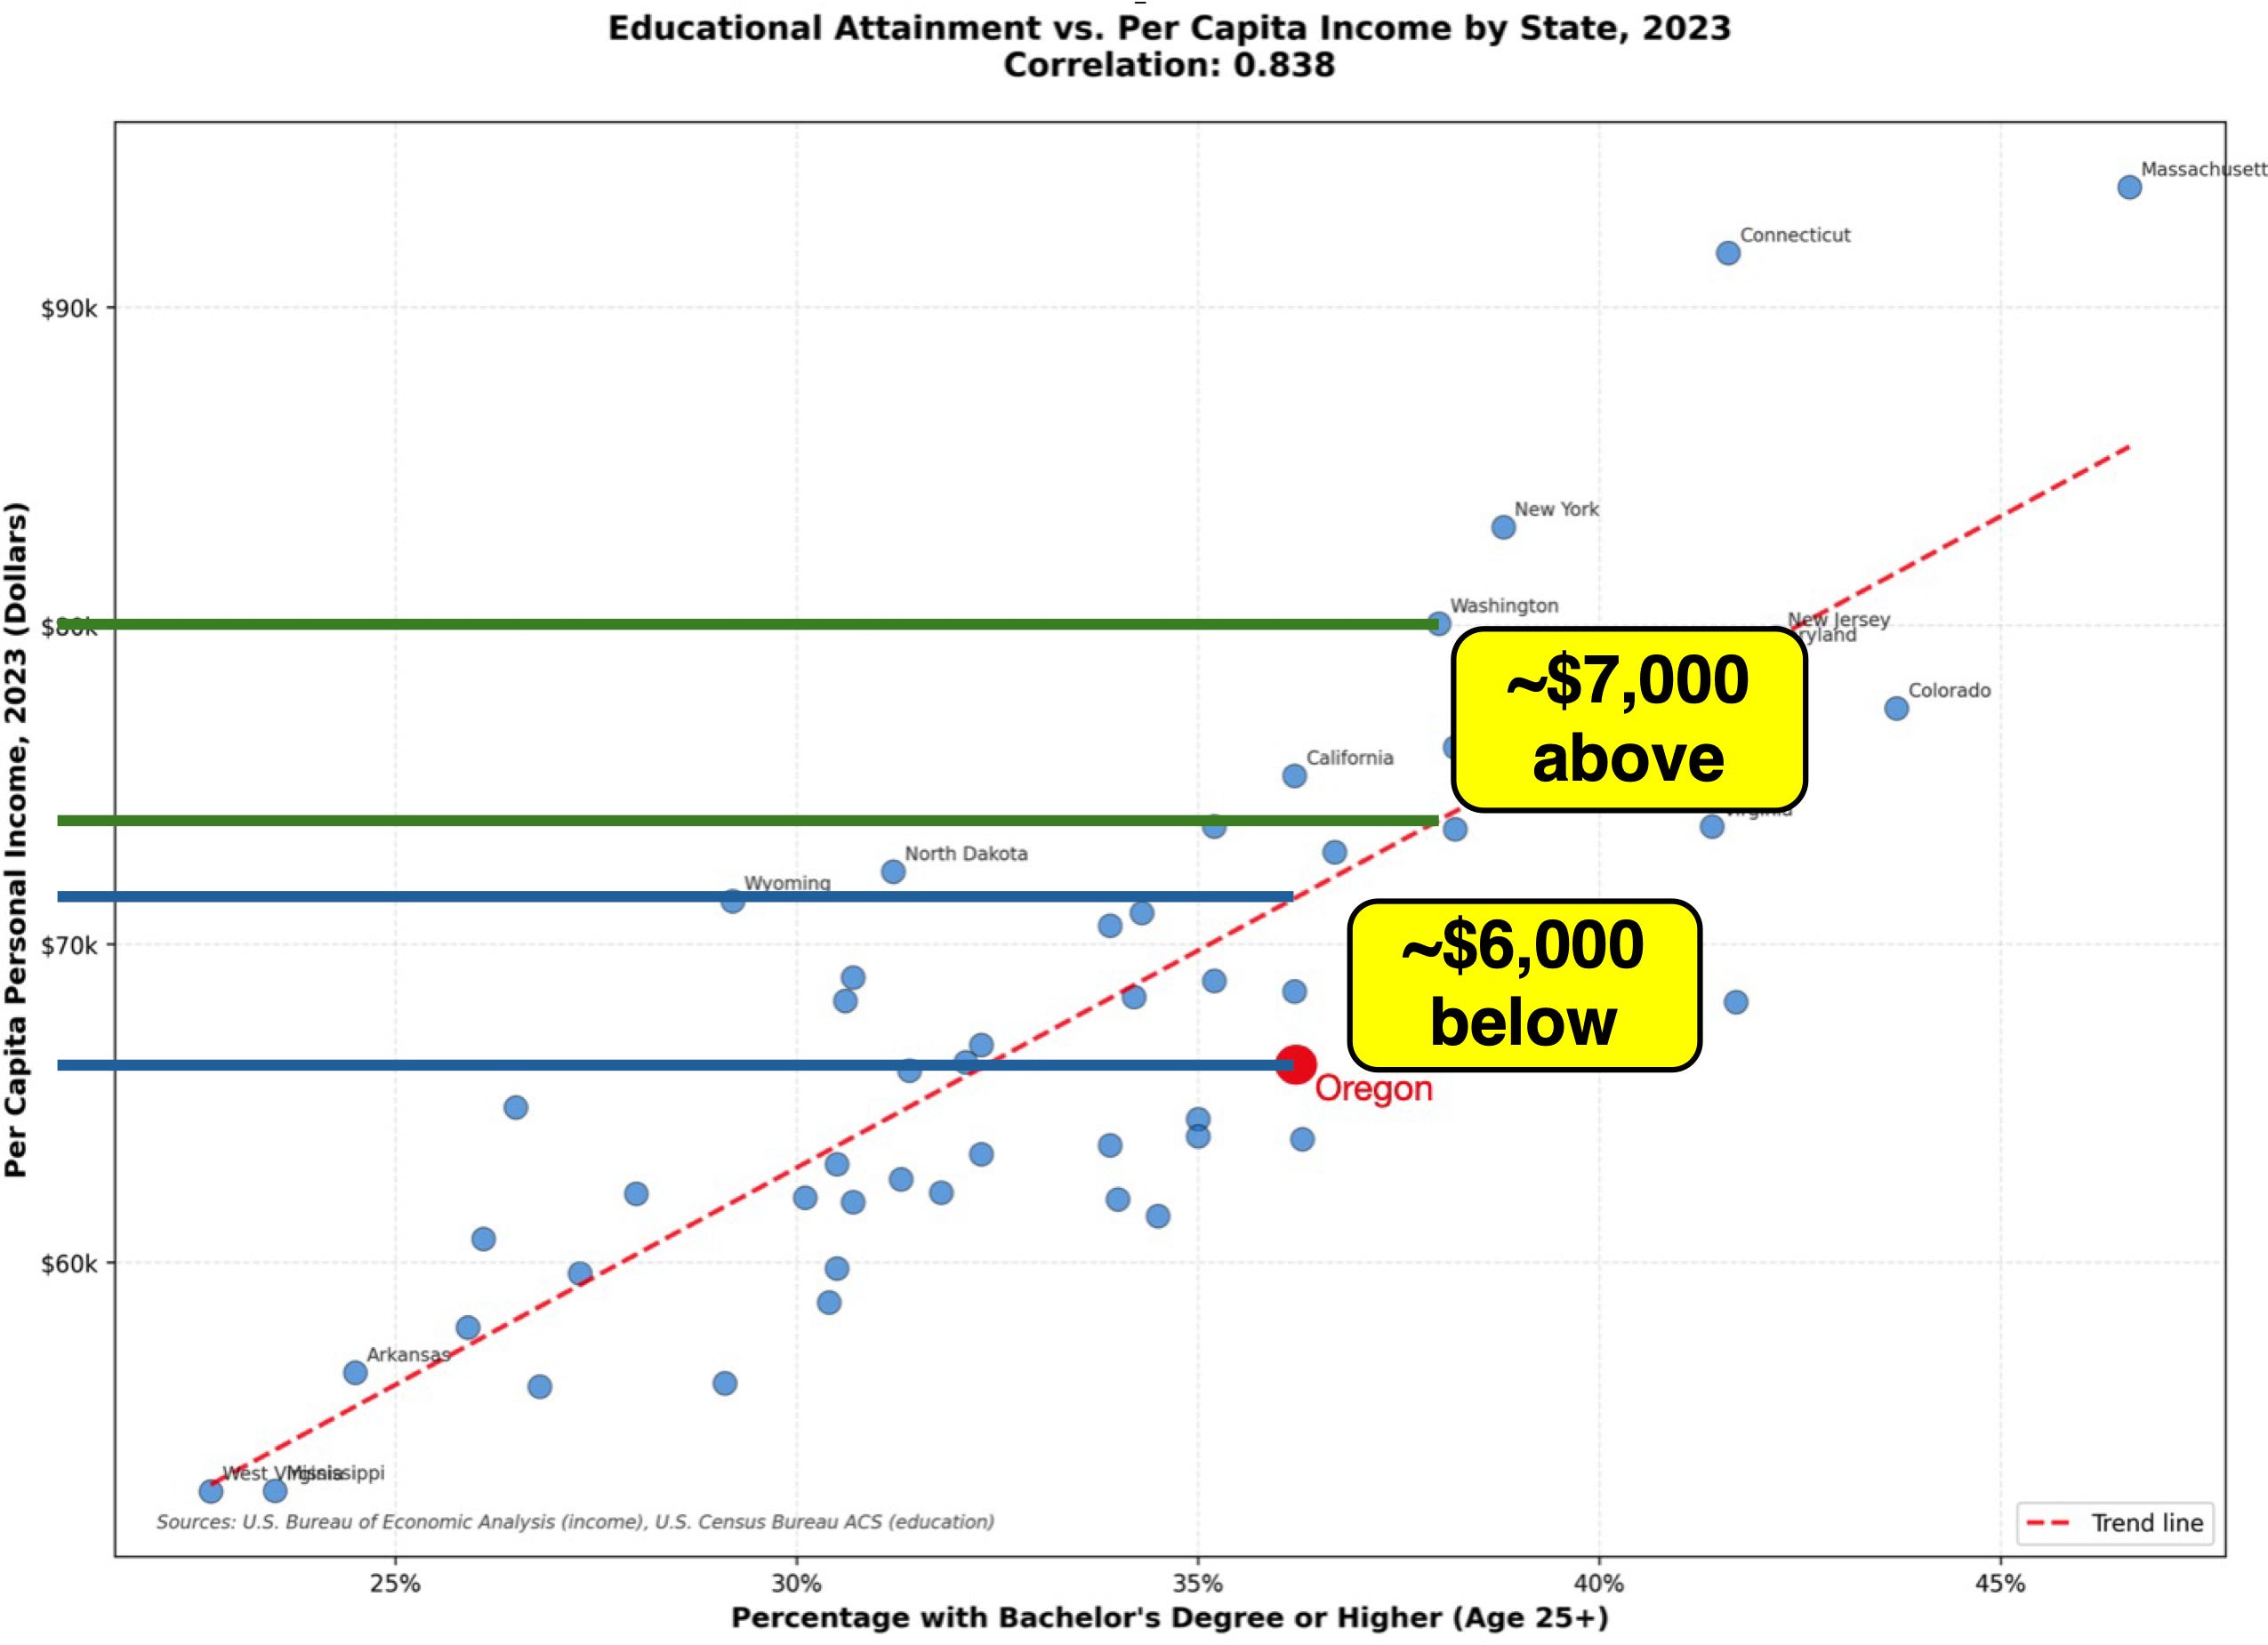
The High Road report’s analytical core is a single chart: educational attainment plotted against per capita income across the fifty states, with a correlation coefficient of 0.84, which the report interprets as saying that roughly 70% of the variation in state income is “explained” by the share of adults holding a four-year degree. I won’t debate the correlation coefficient, but it’s worth repeating the age-old statistician’s adage: “Correlation is not causation.”
The scatterplot is a snapshot of accumulated levels in a single year. The share of the population with a college degree builds over generations, as residents graduate and educated people move in and out of the state. Every college graduate has spent at least 16 years getting there. A snapshot of a single year, in this case 2023, says nothing about what changing any policy would do at the margin—and that’s the only question the Prosperity Council actually faces.
Furthermore, in a statistical analysis with a single explanatory variable, that variable collects the credit for everything correlated with it—industry mix, density, coastal location, decades of inherited wealth. The 30% that the correlation coefficient does not account for is not some bucket of factors labeled “everything else.” It is the portion that the one-variable picture fails to capture. You cannot read the size of a model’s blind spot as proof that nothing else matters.
Most importantly, the causation runs both ways: education “causes” income as much as income “causes” educational attainment. Educated people move to high-income places, so a high degree share is partly a result of prosperity rather than solely a cause of it. The report concedes the mechanism without noticing what it concedes.
The 2007 Oregon Business Plan cited in the report acknowledges that a portion of Oregon’s attainment “will come from newcomers.” That is the story of how Portland’s college-degree share rose from below the national average to well above it over two decades. Oregon imported its educated workforce. That engine has stalled, for the same reason the migration numbers have turned.
There is also a detail in the report’s own chart that the authors miss. Oregon is way off the trendline. It sits about $6,000 below it, while Washington—the same Northwest corner of the country, a similar share of college graduates—sits roughly $7,000 above the trendline. On the report’s own terms, that is a verdict.
Given how educated Oregon already is, the state earns less than the report’s own model predicts, and its neighbor earns more. Whatever pulls Oregon beneath the line is, by construction, one of the things the chart leaves out. In other words, some of the things the reports say do not matter seem to matter enough that there is a $13,000 gap in Oregonians’ incomes relative to Washingtonians’. That’s a big gap, and Oregonians are responding with moving trucks.
This matters for the report’s central recommendation: to fund education more heavily. Oregon already spends about $20,900 per K-12 student, 20th-highest in the country, and its fourth-graders rank second-worst in math and are tied with 10 other states for third-worst in reading.
The constraint is not the number of dollars. It is that the dollars do not reach the classroom, and the largest reason they do not is a subject the report never raises: the Public Employees Retirement System, whose unfunded liability runs to $29.4 billion or more and now consumes about 27 cents of every public payroll dollar. A plan that calls for more education spending while saying nothing about where current education spending goes has identified a symptom and looked away from the cause.
The unions’ report is right that Oregon funds higher education thinly and has let university tuition climb. That is a fair criticism of past legislatures, not an argument about business taxes.
The claim that does the most work and survives scrutiny the worst
The unions’ report makes the bold assertion that taxes don’t matter: “business relocation has little to do with alleged poor business climate.” It claims that studies find no link between state tax burdens and income, that taxes are only about 2% of the cost of doing business, and that the Corporate Activity Tax (CAT) touches just 5% of filers.
The report claims, “There is no compelling evidence that Portland’s supplemental income taxes on the most affluent or the CAT undermine prosperity or that reducing those taxes will benefit the state.”
Here, the report’s authors repeat the same error as their interpretation of the education chart. Comparing tax levels against income levels across 50 states with different industries and geographies tells you nothing about what happens at Oregon’s margin when a particular high earner or a particular firm decides whether to stay.
The figure that moves behavior is not the average burden. It is the marginal rate facing the mobile. A senior manager with a work-from-home job doesn’t need a complicated spreadsheet to figure out that moving across the river can save tens of thousands of dollars in taxes while receiving better public services.
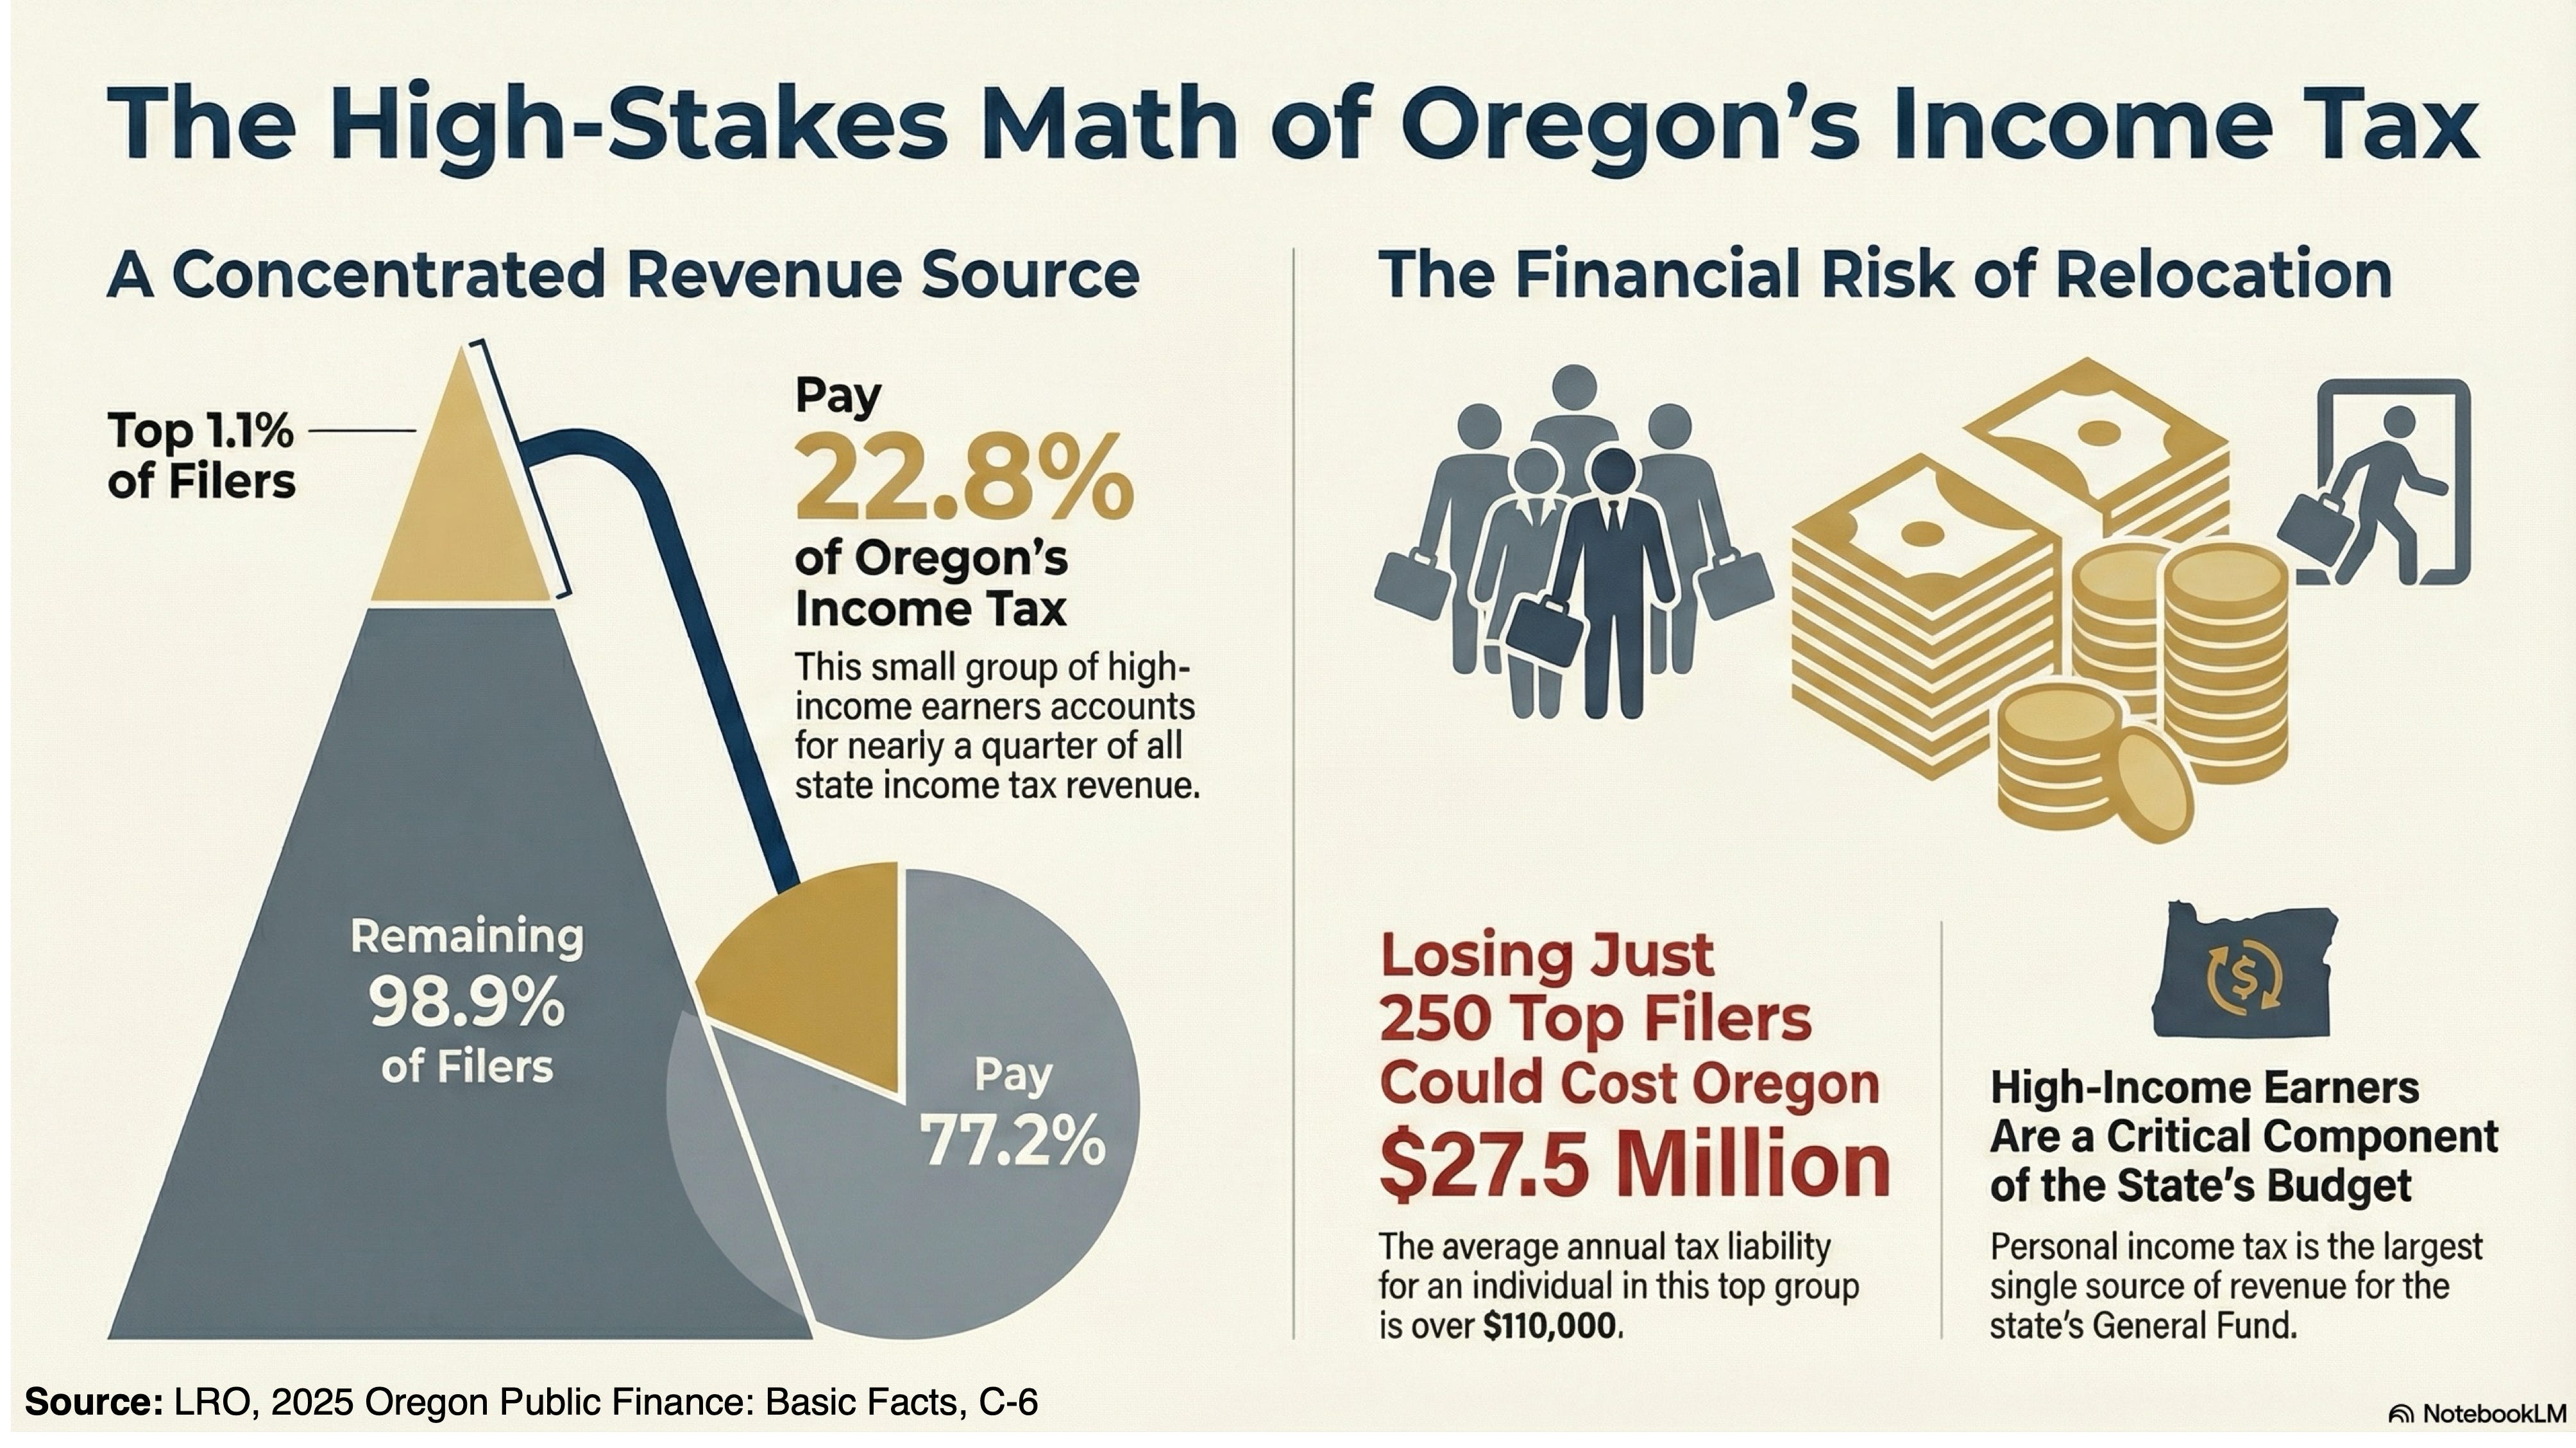
The top 1.1% of Oregon tax filers account for nearly 23% of the state’s personal income tax revenues. That’s fewer than 25,000 filers. If only 1% of that top 1%—250 filers—leave Oregon, the state will lose $27.5 million in income tax revenues.
And by that measure, Oregon now treats the very talent the report says it must keep about as harshly as anywhere in the country. A high earner in Portland faces a combined state and local marginal rate of about 14%, second only to one other jurisdiction. The report’s own framework holds that firms now follow talent. If that is true, then taxing talent at close to the highest rate in the nation is not a footnote to the competitiveness question. It is the competitiveness question.
The CAT is a gross-receipts tax of 0.57% that pyramids—it applies again at each stage of production, so the burden on a low-margin business runs well above 0.57% of its profit. With pyramiding, the CAT is passed along in the prices other businesses charge, which customers ultimately pay. The $1 million threshold also means the tax lands on relatively small firms. A tax can hit a few filers and still shape a lot of behavior.
When two companies carry the state
The unions’ report also argues that Oregon’s weakness is just the national slowdown, plus two bad years at Intel and Nike. The national backdrop is real—employment growth has been sluggish for the past two years.
But if two firms can swing a state’s numbers that far, that is a diagnosis, rather than a reason for calm. The same concentration that flatters Oregon’s productivity in good years exposes the whole state in bad ones. More importantly, over the past few years, Oregon has slipped relative to its immediate neighbors, a trend that a national tide cannot explain.
The false choice
The report tries to win much of its argument with a stark choice for the Prosperity Council: follow a “high road” that invests in people or take a “low road of doing everything other states do, just more cheaply.”
Put that way, the choice makes itself. Strawmen are easy to spot, and I have yet to hear anyone seriously offer the “low road” approach.
There is a real opportunity for reform that addresses Oregon’s unique challenges:
Restructure the gross-receipts tax,
Stop taxing mobile talent at near-national-high rates,
Clear the land-use and permitting bottlenecks that let a single appeal to LUBA stall a project for years, and
Confront PERS so that education money reaches students.
None of these reforms is a race to the bottom. You can hold that human capital matters most and still see that a state that neither educates its own children well nor retains the educated adults it once imported has a problem that more spending alone will not solve.
The unions’ report is an accurate account of the Oregon that existed before the state’s turn for the worse. Read against more recent data, and the report’s conclusion reverses. The prosperity it celebrates was built on imported talent and a concentrated technology base, both now eroding. The tax structure it defends is helping them erode faster.
Inheritance is not income. A plan that treats the two as the same thing is not a roadmap. It is a look in the rearview mirror that keeps our eyes off the road ahead.
Kendall here is an overview of the in vs out migration: The Income Gap: Who is Moving In vs. Out? Analysis of the most recent IRS migration data indicates a sharp disparity in earning power between inbound and outbound residents, particularly in the state's economic hub. Leaving (High Earners): Residents moving out of the Portland metro area had an average adjusted gross income (AGI) of approximately $105,800. Arriving (Lower Earners): New residents moving into the area averaged roughly $73,500 in annual income. The "Wealth Gap": This creates a net income loss of roughly $32,000 per household replaced. This further illustrates why Oregon needs to course-correct on the taxation issue. There is a reason the higher earners are leaving—most of the new taxes target them.
Both the SEIU and the OSB&CTC are almost exclusively suckled on the Government teat so anything in Oregon that would interfere with the flow is going to be opposed. Not exactly honest brokers. I am curious and may have missed it in you excellent article, what is the income level and net worth of out-migrant vs. in-migrant and how many are in each group.